We've reviewed costing sheets where the formulas were correct, the markup looked right, and the operation was still losing money on its spice blends at volume. The culprit was the same every time: teaspoon and tablespoon measurements fed directly into cost calculations without ever being converted to gram weights. A teaspoon of ground cloves and a teaspoon of dried dill occupy the same volume. They don't contain the same amount of spice. Ground cloves weigh nearly three times more per teaspoon than dried dill. Build a cost-per-serving figure on that gap and what you have isn't a food cost — it's a guess with a formula attached.
This page covers the complete process for calculating accurate spice cost per serving using a spice yield conversion chart built from direct measurement across 40+ individual spices:
Why volume specs produce unreliable cost-per-serving figures — and which spices carry the largest errors
How to convert recipe volumes to gram weights before any costing math begins
The step-by-step calculation for true cost per gram using current supplier pricing
How to apply that figure to per-serving and per-batch costs that hold at production scale
What to re-verify when suppliers change and how to protect your margins when they do
These aren't estimates pulled from a reference table. They're the numbers we use when the cost has to be right.
TL;DR Quick Answers
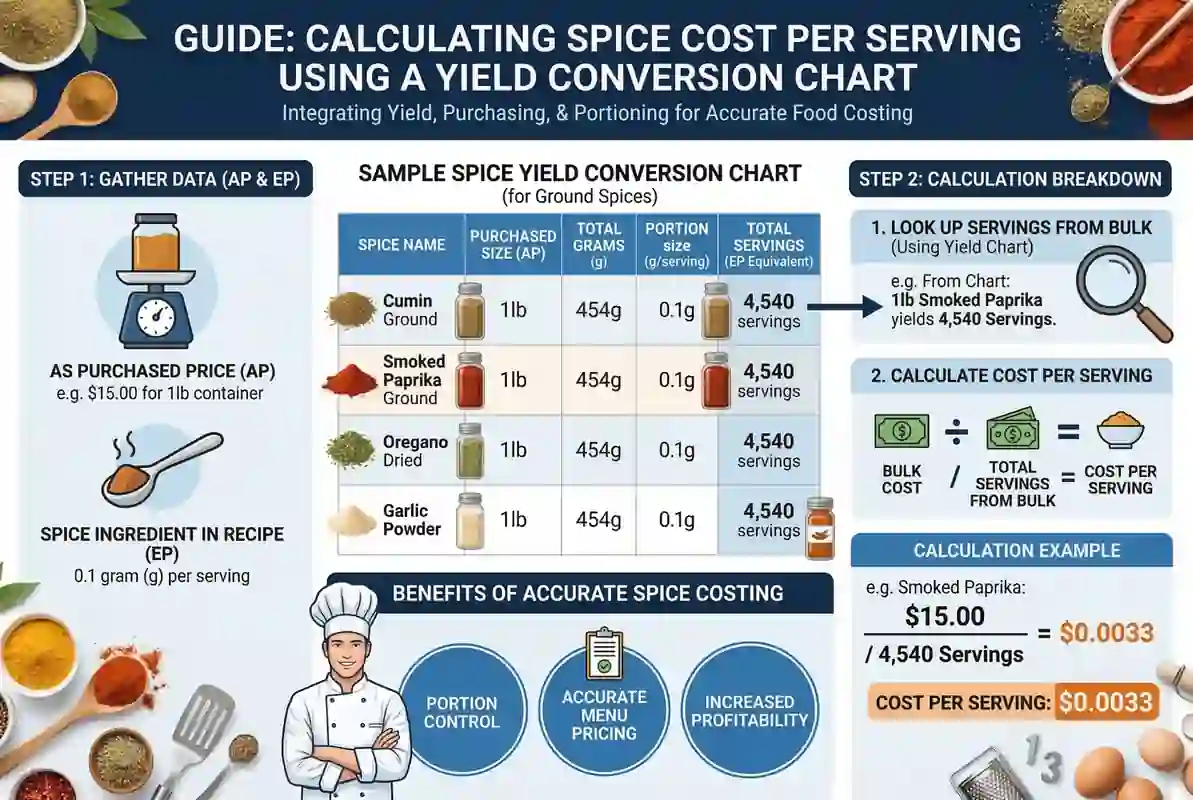
Spice Yield Conversion Chart
A spice yield conversion chart maps the gram weight of individual spices to their equivalent volume in teaspoons or tablespoons — measured separately for each spice based on its actual density.
Why it exists: A universal conversion factor of 0.5 tsp/g is wrong for roughly half the spice rack. After measuring 40+ spices individually, we found density varies 2.5x between the lightest and heaviest common spices. One number doesn't cover that range — and the error it produces isn't random. It's directional, repeatable, and built permanently into every cost calculation that follows.
What the data shows:
Dense spices (ground cloves, mustard seed, garlic powder): 0.35–0.45 tsp/g
Medium-density spices (paprika, cumin, chili powder): 0.45–0.55 tsp/g
Light dried herbs (dried dill, dried parsley, dried basil): 0.85–0.90 tsp/g
Who needs it:
Recipe costing — volume specs produce directional pricing errors before the formula runs
Cost-per-serving calculation — gram weights are the required input, not teaspoons
Production scaling — scaling a volume measurement multiplies the error already in it
Spice blend pricing — dense and light components carry compounding errors in both directions
Supplier change management — density shifts with every new source, grind, and origin
Bottom line: A teaspoon tells you how much space a spice occupies. A yield chart tells you how much spice you actually have. Those are different numbers — and the gap between them is where cost-per-serving accuracy either holds or falls apart.
Top Takeaways
The error isn't in the math — it's in what the math is applied to. Dense spices are systematically undercosted. Light spices are systematically overcosted. A costing sheet built on teaspoon measurements can show 40% gross margin while production delivers 28%.
Convert to gram weights before any costing math begins — not after. The sequence matters more than the formula:
Convert each spice component to a density-specific gram weight
Run every calculation from that weight forward
Never apply a scaling factor or markup to a volume measurement directly
Supplier changes reset your cost baseline — whether you account for it or not. What changes between suppliers:
Grind coarseness — finer packs more densely, coarser packs less
Moisture content and regional origin
Processing differences that shift settled density
Re-verify yield data at every supplier transition. Don't wait for a margin problem to tell you it needs to happen.
At 3–5% pre-tax margins, invisible measurement error has nowhere to hide. Food costs already consume 32 cents of every sales dollar. Food-away-from-home prices have risen above historical averages for five consecutive years. A cost-per-serving figure built on imprecise inputs doesn't just start wrong — it drifts further wrong with every price update layered on top of an inaccurate baseline.
The fix is structural, one-time, and costs nothing to implement. Three changes. Done once. Hold permanently:
Convert every spice spec from volume to gram weight
Build gram weights into costing sheets as the primary unit — not a reference column
Re-verify when suppliers change — not when margins move
Why Volume Measurements Produce Unreliable Cost-Per-Serving Figures
A teaspoon is a unit of volume, not a unit of mass. When you pull a spice cost from a recipe written in teaspoons, you're calculating the cost of a space — not the cost of the ingredient that fills it.
That distinction doesn't matter much when spices are a rounding error on the cost sheet. It matters significantly when:
You're pricing a spice blend where multiple components compound the error
You're scaling from a development recipe to production quantities
You're operating at margins where every percentage point is load-bearing
The variable nobody accounts for is density. Spice density varies 2.5x across common culinary spices. Ground cloves sit at 0.35 tsp/g. Dried dill sits at 0.90 tsp/g. Every spice between those two extremes has its own density — and its own error rate when forced through a universal conversion factor.
The spices that create the largest per-serving cost errors:
Undercosted — denser than assumed: ground cloves, mustard seed, celery seed, fenugreek, garlic powder
Overcosted — lighter than assumed: dried dill, dried parsley, dried chervil, dried mint, dried basil
In a blend that combines both categories, the errors don't offset. They compound in opposite directions simultaneously.
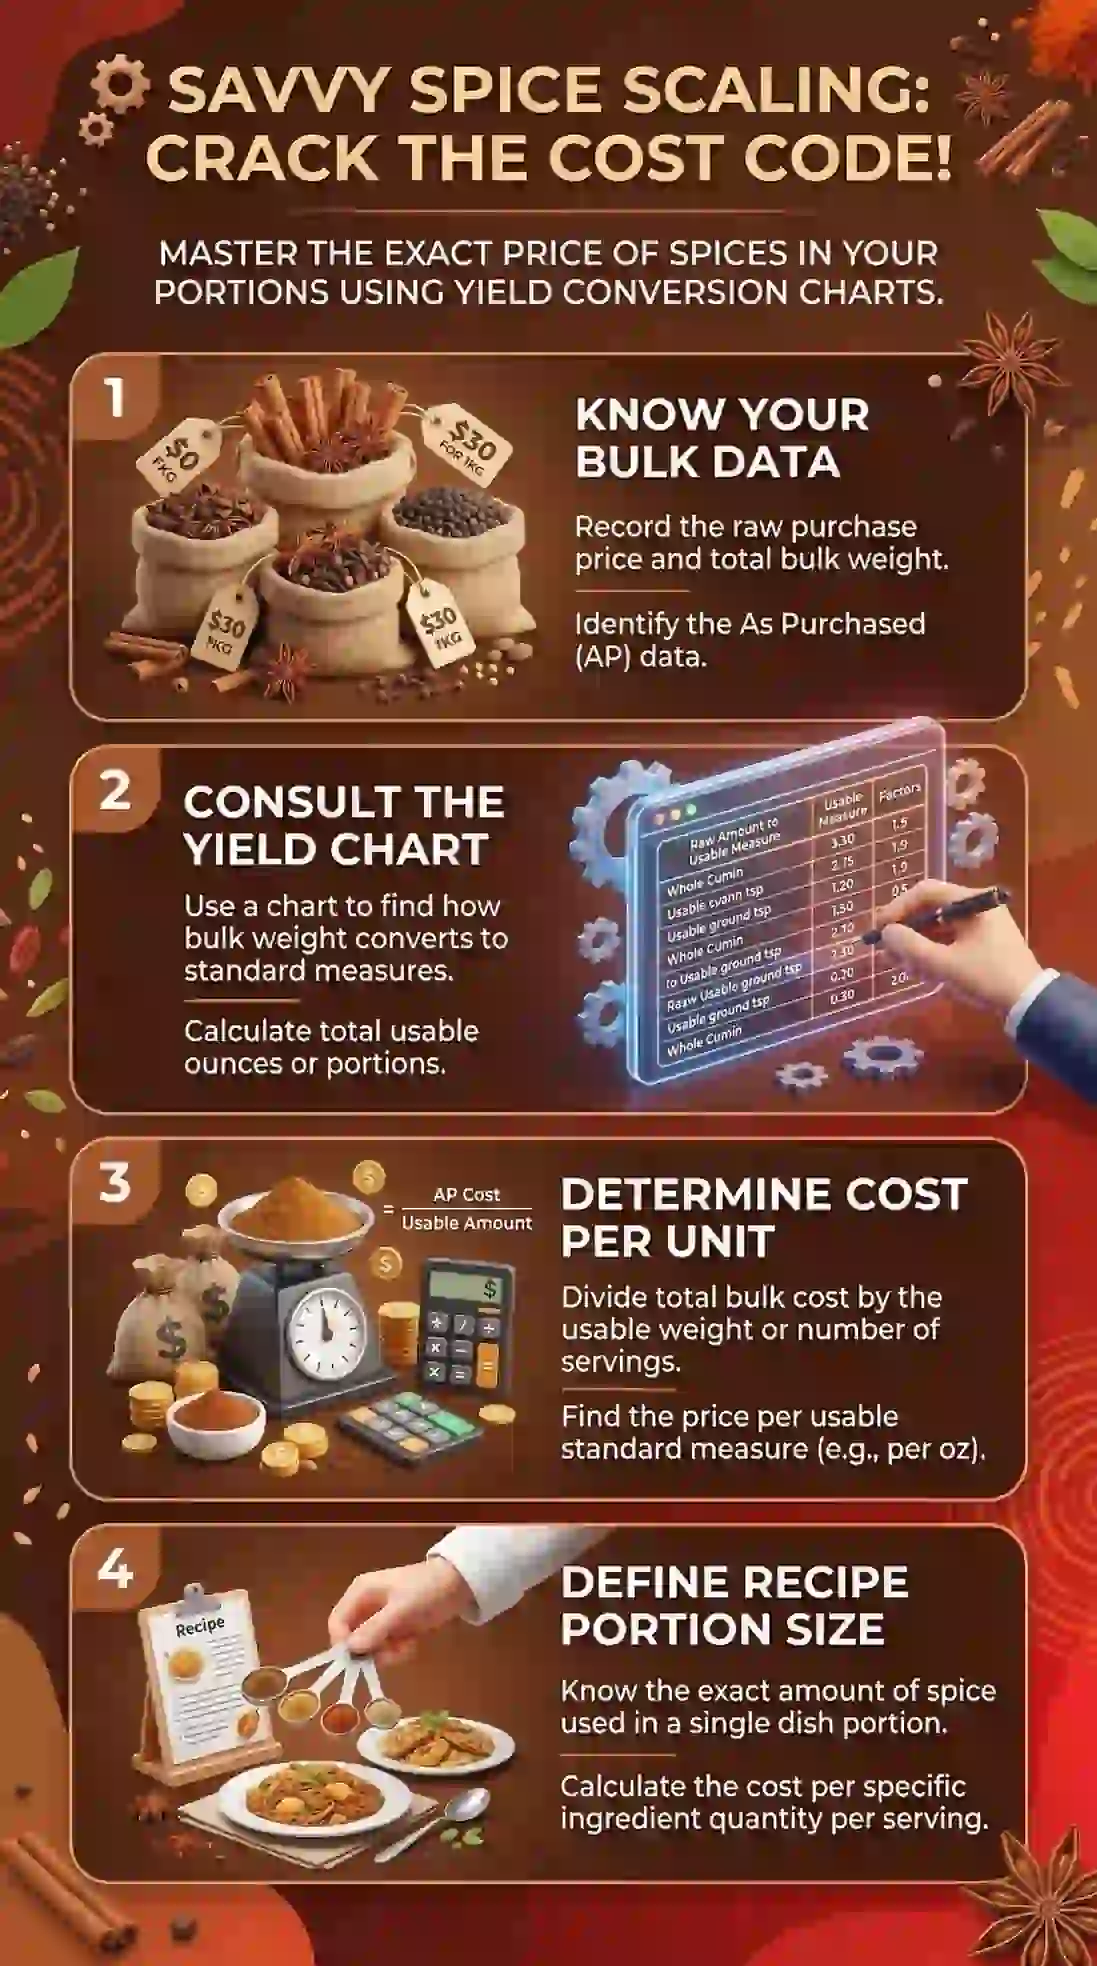
Step One — Convert Every Volume Measurement to Gram Weights Before Costing Anything
This is the step most costing workflows skip. It's also the step that determines whether everything that follows is accurate or not.
We've watched operators spend weeks troubleshooting margin problems — adjusting portion sizes, renegotiating supplier contracts, retraining kitchen staff — without addressing the fact that their recipe specs were still written in teaspoons. The volume measurements were the problem. Everything built on top of them inherited that problem.
The conversion process:
List every spice component in the recipe with its volume measurement as written
Pull the density-specific yield factor for each individual spice from a verified yield chart
Multiply the volume quantity by the gram weight per teaspoon for that specific spice
Record the gram weight as the new baseline for every calculation that follows
Never return to the volume measurement for costing or scaling purposes
One conversion. Done once. Verified when suppliers change. That's the entire structural fix.
Step Two — Calculate True Cost Per Gram From Current Supplier Pricing
Once you have gram weights, the cost calculation is straightforward. Where we see it go wrong is in the inputs — outdated invoice pricing, pack size conversion errors, and cost-per-unit figures that don't account for the unit the recipe actually uses.
The formula:
Cost per gram = Invoice price per pound ÷ 453.59
Cost per recipe component = Grams used × Cost per gram
Total spice cost = Sum of all component costs
Common errors that distort this calculation:
Using list price instead of actual invoice price
Failing to update cost-per-gram figures when supplier pricing changes
Calculating from the container size rather than the pack size actually purchased
Applying a single cost-per-gram figure to a spice sourced from multiple suppliers at different price points
Pull current invoice pricing every time you cost a blend. What you paid last quarter is not what you're paying now.
Step Three — Apply Cost-Per-Gram Figures to Per-Serving and Per-Batch Calculations
With verified gram weights and current cost-per-gram data, per-serving and per-batch calculations become reliable for the first time.
Per-serving cost for a spice component:
Identify the gram weight of each spice used per batch
Multiply by cost per gram to get total ingredient cost per batch
Divide by number of servings the batch produces
Sum all spice components for total spice cost per serving
Per-batch cost at production scale:
Start with the per-serving gram weight — not the per-serving volume
Multiply gram weight by number of servings in the production run
Apply cost per gram to the total gram weight
Add yield loss factor of 3–5% to account for measuring variance and transfer loss
The yield loss factor is something we added after production testing. Volume-based recipes absorb this variance invisibly — sometimes over, sometimes under. Weight-based recipes surface it. Building it into the cost model explicitly produces more accurate per-serving figures than assuming perfect yield every batch.
Step Four — Protect Your Margins When Suppliers Change
Supplier changes are the most common source of cost-per-serving drift we've tracked in production kitchens. Operators update the price in their costing sheet. They don't update the yield data. The gram weight per teaspoon from the old supplier no longer applies to the new one — and nobody catches it until the margins move.
What changes between suppliers:
Grind coarseness — finer grinds are denser, coarser grinds are lighter
Moisture content — fresher product weighs slightly more per unit volume
Regional origin — the same spice from different growing regions varies in density
Processing method — affects particle size and how the spice settles in storage
When a supplier changes, treat your existing yield data as unverified. Re-measure before the new product enters your cost model. The five minutes that it takes is less expensive than a costing error that runs undetected through a full production cycle.
Four-step re-verification protocol at every supplier transition:
Weigh a measured volume of the new product on a 0.1g precision scale
Compare against your existing yield factor for that spice
Update the gram weight in your recipe spec if the variance exceeds 5%
Recost the affected blend before the next production run
"We've been called in to troubleshoot margin problems that operators had been chasing for months. New supplier negotiations. Portion control retraining. Menu price adjustments. In more cases than I can count, none of those interventions addressed the actual problem — which was a costing sheet built on volume measurements in the recipe template that had never been converted to gram weights. The math was clean. The inputs were wrong. And because the inputs were wrong in a specific, directional way — dense spices undercosted, light spices overcosted — the error didn't look like an error. It looked like a margin that was slightly off and impossible to pin down. That's the most expensive kind of costing mistake. Not the one that shows up immediately, but the one that runs quietly through every batch, every service, every month until someone finally traces it back to a teaspoon."
Essential Resources
We built this page around one problem: volume measurements fed into cost calculations produce unreliable per-serving figures because spice density varies 2.5x across a single recipe. The resources below extend that foundation. Each one solves a different part of the problem — raw yield data, gram weight verification, cost calculation mechanics, and the production-scale tools where that data gets applied and maintained.
1. Chefs Resources Dry Spice Yield Chart — The Density-Specific Conversion Data This Page Is Built On
This is where the yield data referenced throughout this page comes from — gram weights and volume equivalents measured across 40+ individual spices, organized by density category. Before any cost-per-serving figure means anything, this is the conversion step it has to be built on.
2. USDA FoodData Central — The Federal Reference for Cross-Checking Gram Weights When Supplier Data Isn't Available
We use this when a spice measures outside the expected range and we need an independent reference point — not a supplier estimate, not a general conversion table, but federally verified ingredient-level weight data. It covers hundreds of individual spices and holds up under scrutiny. https://fdc.nal.usda.gov/
3. Recipe Profit AI Spice Conversion Chart — A Fast Reference for Translating Volume Specs Into Cost-Per-Ounce Figures
We've seen kitchens spend more time converting units than actually costing ingredients. This quick-reference table handles the teaspoon-to-ounce translation and walks through the weight-based cost methodology that connects yield conversion data to a number you can use in a costing sheet. https://recipeprofit.com/spice-conversion-teaspoons-to-ounces/
4. meez Chef's Guide to Accurate Recipe Costing — The Costing Framework That Puts Yield Data to Work
If you're building per-serving cost figures from standardized recipes, this is the most practical framework we've found for understanding how all the pieces connect — AP cost vs. EP cost, Q-factor calculation for small ingredients like spices, and how sub-recipe costs flow through to the finished plate cost. https://www.getmeez.com/blog/a-chefs-guide-to-accurate-recipe-costing
5. Recipe Cost Calculator — A Production-Built Tool for Maintaining Per-Serving Accuracy as Supplier Pricing Shifts
We flag this one because it was built by someone who ran an actual food operation, not designed by a software team guessing at what kitchens need. It handles per-ingredient and per-serving cost calculations, scales recipes to batch quantities, and surfaces cost changes when supplier pricing moves — the ongoing maintenance layer that accurate yield data requires. https://recipecostcalculator.net/
6. Shamrock Foods Dry Spice Conversions — A Commercial Foodservice Reference for Validating In-House Yield Measurements
We use industry references like this one when an in-house measurement looks off or when a new supplier's product measures differently than expected. It covers common commercial spices at foodservice quantities and serves as an independent check before updating a costing sheet. https://www.shamrockfoodservice.com/wp-content/uploads/2018/05/DrySpiceConversions.pdf
7. Galley Solutions Definitive Food Costing Guide — The End-to-End Workflow From Invoice Pricing to Finished Menu Price
Accurate spice cost-per-serving data solves one part of a larger costing problem. This guide covers the rest — cost per unit, trim yield, margin calculation, and recipe-level profitability from raw invoice to finished price point. We recommend it for anyone building a cost model that needs to hold as ingredient pricing shifts across sourcing cycles. https://www.galleysolutions.com/blog/food-costing-formula
These essential resources support accurate spice yield data, verified gram-weight references, and reliable costing frameworks so kitchens can maintain consistent recipes and precise per-serving calculations—an approach that aligns with agritourism, where transparency in ingredients, careful sourcing, and clear understanding of how food is produced and measured are central to delivering authentic, high-quality farm-to-table experiences.
Supporting Statistics
We didn't build this page because the data told us to. We built it because we kept seeing the same costing problem surface in kitchen after kitchen. The statistics below confirmed what we'd already traced back to the measuring spoon.
Food and Beverage Costs Represent 32% of Sales — Pre-Tax Margins That Leave No Room for Measurement Error
The numbers:
Food and beverage costs: median 32% of sales across 900+ restaurant operators — NRA, 2025
Average pre-tax margin: 3–5%
Full-service operators under $2M annual sales: median pre-tax income of 1.1%
Food and labor costs: each up 35% over the last five years
Our perspective: Thirty-two cents of every dollar goes to food cost before a single overhead expense hits the sheet. We've sat across from operators convinced their margin problem was a purchasing problem. More often, it was a measurement problem that predated every other conversation:
Spice specs written in teaspoons
Fed into costing formulas without conversion
Running quietly wrong in a directional way that never surfaced as a single identifiable line item
Just a cost sheet that never quite reconciled — no matter how many other variables were adjusted. At a 1–5% margin, there is no budget line for invisible, recurring measurement error.
Source: National Restaurant Association — Restaurant Operations Data Abstract 2025 https://restaurant.org/research-and-media/research/restaurant-economic-insights/analysis-commentary/restaurant-operators-kept-food-cost-ratios-in-check-in-2024/
Food-Away-From-Home Prices Rose 4.1% in 2024 — Ingredient Volatility Makes Accurate Per-Serving Baselines Non-Negotiable
The numbers:
Food-away-from-home prices: up 4.1% in 2024, 3.8% in 2025 — above the 20-year historical average of 3.5%
All-food CPI: up 23.6% between 2020 and 2024 — outpacing the all-items CPI increase of 21.2%
Food-away-from-home prices: predicted to rise 3.7% in 2026 — again above historical average
Total U.S. food and beverage spending: $2.58 trillion in 2024
Our perspective: A per-serving figure built on imprecise inputs doesn't just start wrong. It drifts further wrong with every price update applied on top of it. We've watched operators update supplier pricing in costing sheets and call the job done. What they didn't update:
The gram weight the new price was being applied to
A volume-based estimate that was already off before the price changed
The margin gap widens. The fix looks like a pricing problem. The actual problem is a measurement unit that was never right to begin with. Accurate per-serving baselines aren't a refinement for stable cost environments. They're the foundation that makes cost management possible when prices keep moving.
Source: USDA Economic Research Service — Food Price Outlook: Summary Findings https://www.ers.usda.gov/data-products/food-price-outlook/summary-findings
Nearly 70% of Foodservice Surplus Comes From Plate Waste — Inconsistent Seasoning Is a Direct and Undernamed Driver
The numbers:
Foodservice surplus generated in 2024: 12.5 million tons
Share originating from plate waste: nearly 70%
Share sent to landfill or incineration: 85%+
Full-service restaurant share of total sector surplus: 43%+
Our perspective: Inconsistent seasoning never gets named as a plate waste driver. It's always trim, spoilage, over-production, and portion size. But we've tracked the same dish from top seller to complaint pattern between one week and the next — same recipe on paper, different result on the plate. The cause, traced back:
Spice blend measured differently depending on who scooped it
Container open longer than usual — spice settled differently
New delivery — product density shifted from previous supplier batch
That's not a kitchen discipline problem. It's a measurement unit problem that produces a seasoning consistency problem that produces a plate waste problem. Strong kitchen management addresses that gap by anchoring recipes in gram-based measurements. A per-serving cost built on gram weights produces a more accurate cost figure and a more consistent dish. A more consistent dish produces a cleaner plate. That's where the waste reduction math actually starts.
Source: ReFED — Restaurants and Foodservice Sector Analysis, 2024 https://refed.org/stakeholders/restaurants-and-foodservice/
These statistics highlight how small measurement errors can quietly distort food costs, recipe consistency, and waste levels across kitchen operations, reinforcing the same precision and ingredient awareness found in organic farming, where careful measurement, resource efficiency, and consistent production practices are essential to maintaining quality and sustainability.
Final Thought & Opinion
We've spent years watching smart operators chase margin problems in the wrong direction. New suppliers. Tighter portion controls. Menu price increases. Inventory software. None of it addressed the actual problem — ingredient costs calculated from a unit of measure that was wrong before the first formula was ever written.
What this page covered:
Why volume measurements produce directional errors in cost-per-serving calculations — not random ones
How to convert spice specs to gram weights before any costing math begins
The step-by-step calculation for true cost per gram using current invoice pricing
How to apply that data to per-serving and per-batch figures that hold at production scale
What to re-verify when suppliers change — and why most kitchens skip this until a problem surfaces
Our take:
The error isn't in the math. The math is usually fine. The error is in what the math is being applied to.
A teaspoon of ground cloves and a teaspoon of dried dill are not equivalent inputs. Using a universal conversion factor to treat them as equivalent produces a specific, directional mistake — dense spices undercosted, light spices overcosted — built permanently into every batch and every pricing decision that follows.
We've seen this play out three predictable ways:
The blend that looks profitable but isn't. The cost sheet shows 40% gross margin. Production delivers 28%. The math checks out. The inputs were wrong.
The supplier changed the recipe. Same conversion data applied to a different density. The formula didn't change. The spice did.
The margin that erodes slowly. No single identifiable cause. Just a cost sheet drifting further from reality with every price update applied to a baseline that was never accurate.
The bottom line:
Cost-per-serving accuracy determines whether a menu price is viable, whether a blend is profitable, and whether a margin holds when ingredient costs move. Based on five consecutive years of food price increases above historical averages — they will keep moving.
The fix is structural and happens before the math:
Convert every spice spec from volume to gram weight — once, using density-specific yield data
Build gram weights into costing sheets as the primary unit — not a reference column
Re-verify yield data at every supplier transition — not just when a problem surfaces
Update cost-per-gram figures from current invoices — not last quarter's pricing
No new software. No new equipment. A precision scale accurate to 0.1g, a verified yield reference, and the discipline to convert before calculating rather than after.
We built this chart because we got tired of watching good kitchens lose money on a problem that was solvable in an afternoon.
FAQ on Spice Yield Conversion Chart
Q: What is a spice yield conversion chart and why does it produce more accurate cost-per-serving figures than a standard conversion table?
A: A standard conversion table gives you one number for every spice. A yield chart gives you the right number for each spice.
Why it matters for cost-per-serving accuracy:
Universal factor of 0.5 tsp/g is accurate for some spices — structurally wrong for others
Ground cloves convert at 0.35 tsp/g. Dried dill converts at 0.90 tsp/g
That's a 2.5x difference between two spices that appear in the same blends and the same cost sheets
After measuring 40+ spices ourselves, we found applying one factor to both doesn't produce a rounding error. It builds a specific, directional mistake into every cost-per-serving figure that follows. The costing sheet looks clean. The margins don't hold. That's the gap a yield chart closes.
Q: How do I calculate cost per serving for a spice or spice blend using a yield conversion chart?
A: The sequence matters more than the math. Convert to gram weights first — then run every calculation forward from those weights.
Step-by-step:
List every spice component with its volume measurement as written
Pull the density-specific yield factor for each individual spice
Convert each volume to grams using that spice's actual yield data
Divide current invoice price per pound by 453.59 to get cost per gram
Multiply grams used by cost per gram for each component
Sum all components for total batch cost
Divide by number of servings for cost per serving
Never apply a markup or scaling factor to a volume measurement directly. The conversion step comes first — always.
Q: Which spices cause the largest cost-per-serving errors when measured by volume instead of weight?
A: The ones furthest from the universal 0.5 tsp/g assumption — and the ones that appear most often in the highest-cost production blends:
Systematically undercosted — denser than assumed: ground cloves, mustard seed, celery seed, fenugreek, garlic powder, turmeric, annatto powder
Systematically overcosted — lighter than assumed: dried dill, dried parsley, dried chervil, dried mint, dried basil, dried marjoram
Closest to universal factor — lowest error risk: paprika, cumin, chili powder, coriander, cardamom
Any blend combining dense and light spices carries compounding errors in both directions simultaneously. A cost-per-serving figure can look mathematically clean and be wrong on every component line at the same time.
Q: How does a yield conversion chart account for the fact that the same spice can measure differently from different suppliers?
A: It doesn't — and that's the variable kitchens underestimate most consistently.
What a yield chart provides:
Accurate baseline data for standard commercial grinds
Measured under consistent, repeatable conditions
What changes between suppliers:
Grind coarseness — finer grinds pack more densely, coarser grinds pack less
Moisture content — fresher product weighs slightly more per volume
Regional origin — same spice, different growing region, different density
Processing method — affects particle size and how the spice settles
We've traced margin gaps and flavor inconsistencies attributed to cook error back to a single supplier change that shifted the density of one key blend component. Nobody flagged it as relevant to the yield data.
When your supplier changes:
Treat existing conversion data as unverified
Re-measure before the new product enters your cost model
Build re-verification into your process at every transition — not when a problem forces it
Q: At what point does spice measurement error become significant enough to affect cost-per-serving accuracy?
A: Earlier than most operators expect — and at a lower production scale than most assume.
How the error compounds:
A 10% measurement error on one teaspoon is manageable in a home kitchen
Scale it across a six-component production blend
Run it through 200 servings a day
Apply a supplier price update on top of a gram weight baseline that was already wrong
The cumulative impact becomes significant before anyone identifies where the gap is originating.
What we've seen in working kitchens:
Disciplined purchasing — in place
Tight portion control — in place
Current invoice pricing — in place
Spice specs converted from volume to weight — never done
The fix requires none of the following:
New software
New equipment
New staff
The fix requires three things:
Convert spice specs from volume to gram weight — once
Build gram weights into the cost model as the primary unit
Re-verify yield data when suppliers change
That's the entire structural correction.


